Biodiversity Maps

The variety of life on earth is not spread evenly. Instead, it concentrates in very special places, defined by two things – geography and vulnerability to  extinctions. Much of our science focuses on understanding how many species we lose – and how quickly we lose them – from forest fragments. Our biodiversity maps depict these patterns to guide our conservation efforts.

Studies confirm that species with the smallest geographical ranges, such as those found on mountains, islands, and forest fragments are the most threatened with extinction. In addition, they are most likely to be more severely affected by climate change. In fact, only a small fraction of species with large ranges are threatened, though they tend to more famous! Good examples are species we hunt or, especially for mammals, those that cause us harm (such as lions). Therefore, maps are vital to what we do at Saving Nature. We need lots of them — and lots of kinds of them — because they help us visualize the global problems we address. Yet, our solutions often come down to planting a small tree in an abandoned cattle pasture. To know exactly where we need to plant that small tree, our maps must span scales from the entire globe to small, individual parcels of land.

Guiding Conservation Priorities

Strategic Maps

Our strategy starts with global and regional biodiversity maps – large sets of data we synthesize into conservation action priorities.

These “heat maps” identify places with the highest numbers of threatened and small range species. We produce maps for each species and then sum them up. Red represents the highest concentrations of species, while blue represents low species numbers. 

The example below of biodiversity maps depicts bird species in South and Central America. We have similar maps for mammals and amphibians. 

An Example from South America

With the greatest number of species, one might think the Amazon should be our priority. However in prioritizing species with small geographic ranges, the focus shifts. In this case, the concentration of threatened species is in the Northern Andes (Ecuador, Colombia, and Peru) and the coastal forests of Brazil. 

Saving Nature works in biodiversity hotspots to prevent extinctions and fight climate change. We restore forests to create wildlife corridors that link forest fragments.

Biodiversity Mapping

Using bird species as example, this biodiversity map shows that the Amazon has the greatest total number of bird species. Therefore, one might assume it should be our conservation priority, but as we dig deeper, the focus shifts.

Saving Nature Biodiversity Maps: Small Range Bird Species in South America

Small-range species

In looking at small-ranged bird species, which are most vulnerable to extinction, the Andes and, to a lesser extent along the Atlantic Forest of Brazil, have significantly more species with small ranges than the Amazon.

Saving Nature Biodiversity Maps: Threatened Bird Species in South America

Threatened Bird Species

The distribution of threatened bird species parallels small-ranged species - and for a good reason. Deforestation disproportionately threatens small-ranged species, because it’s easier to destroy their entire habitat. 

Guiding Conservation Actions

Tactical Maps

Many practical conservation actions unfold over a few square kilometers. So we need to focus on these key areas. 

To do so, we create a series of tactical biodiversity maps, like these from our project in Brazil. These biodiversity maps add elevation and habitat lenses to our strategic regional perspective. To produce these maps, we rely upon remote sensing. We combine data from satellite images to show where the forest remains with very detailed maps of elevation. 

This additional detail helps pinpoint where individual species are likely to persist in fragmented landscapes across a range of topographies. Again, we take each species’ map in turn. Of course, species don’t occur everywhere within those boundaries! The habitat has to be right. Many species depend on forests and on large deforested areas. In addition, species have elevation limits, precluding them from places that are too high or too low. 

Identifying Opportunities to Connect Forests

Satellite Imagery

Draping a Google Earth satellite image over an elevation map identifies opportunities to connect isolated forests. The lowland areas in the south and east are mostly converted to crops and grazing land. Some small hills are still covered in forest, as are mountains in the north and west. 

By way of orientation, the União Biological Reserve is at the top-center of the satellite image.

Brazil Satellite Map

Our Most Important Innovation

Data Visualization

This map is one of our most important innovations. First published in Scientific American, it’s since been featured in books that show the best of new mapping techniques. 

It tells us that the concentrations of threatened bird species are in forest fragments around the União Biological Reserve (shown in red) and to the west (shown in orange). It also tells us that União Biological Reserve was too small to hold most of its species the long-term.  

Based on this map, we decided we needed to reconnect those forests. We do so by helping local partners acquire the land and reforest it. Our top priority was to reconnect the forest to lands to the west — and upslope to allow species to move as the climate heats up. In this case, we raised funds for a single piece of property. In others, it’s more complicated.

Saving Nature Biodiversity Map showing threatened bird species in the Atlantic Forest of Brazil

This area of about 200 kilometers east to west covers much of Rio de Janeiro State.

Guiding Land Purchases

Implementation Maps

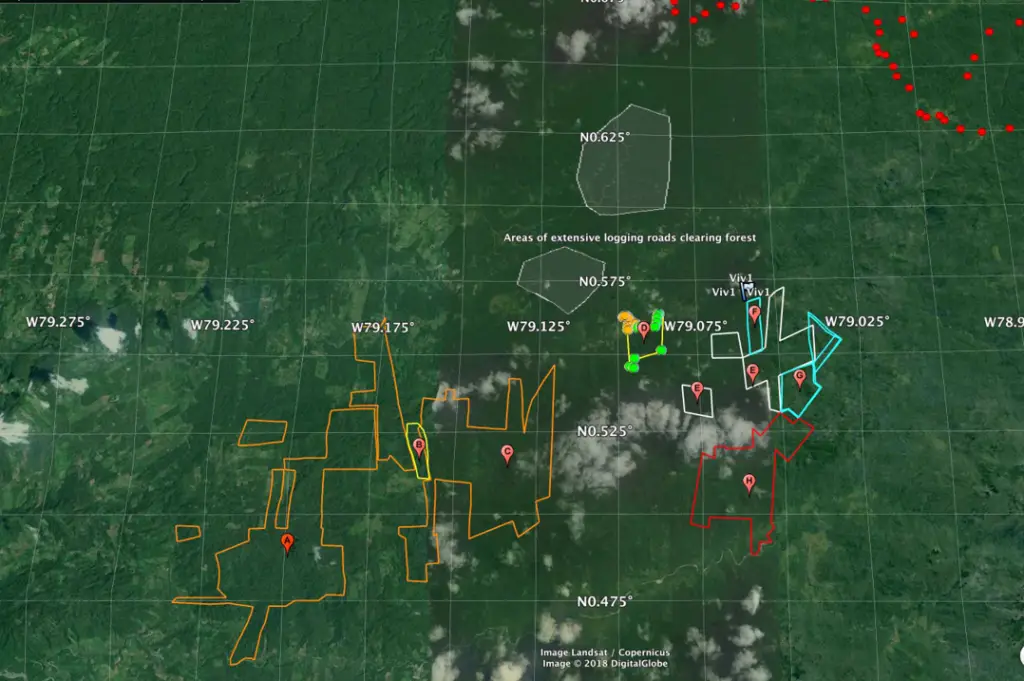
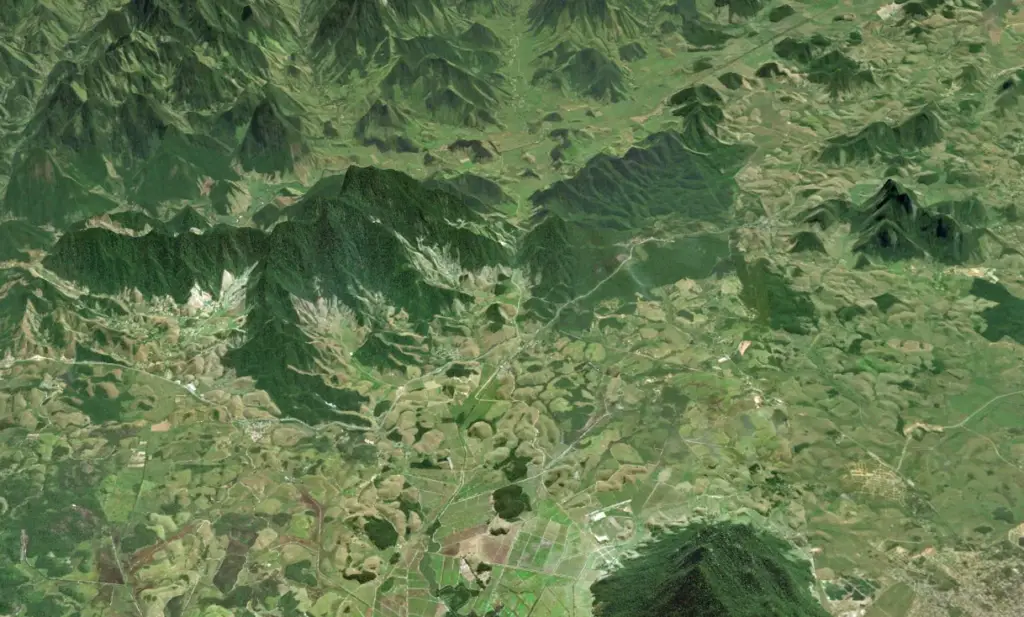
In building a wildlife corridor, there may be a lot of properties on our wish list. To guide our purchases, we produce detailed property maps. For example, this map from our project in Colombia depicts the individual land parcels that comprise the corridor.  The different colors show different property boundaries.

This is not a current map, nor is it the high-quality map we now produce with drone flights. We are cautious about publishing exactly what we want to buy next. If we did disclose the target locations, the owners may inflate the prices.

Saving Nature Map of Target Land Acquisitions in Colombia

Gaining Insights

Evaluation Maps

Understanding the matrix of land uses and how species move through them is a critical part of understanding threats to biodiversity and where to build the wildlife corridor.  Once the corridor begins to take shape, we revisit our maps to design our camera trap network to position them along ancient migration route and recovering forest. We layer these habitat maps with the camera trap data to better understand how species disperse over time. By blending habitat maps and camera trapping data, we evaluate our progress in reintegrating habitat and making it accessible again for threatened and endangered species.

An Example from Sumatra

Saving Nature Map of Land Cover in Sumatra

Land Use / Land Cover

High resolution maps from drone flights helps us visualize the conservation challenges. Our project area is a mix of primary, secondary and old growth forests, communities, and agriculture. 

Camera Trapping in East Leuser

Camera Traps

Once our partners purchase the land and begin reforestation, we deploy camera traps at our reforestation sites to capture various species of animals moving through the new corridor.

Saving Nature Map of Pig-Tailed Macaque Distribution in Sumatra

Species Distribution

Pig-tailed macaque distribution is restricted to  areas that retain forest. We expect that as forest cover returns they will spread out across it to reconnect isolated populations.

Immersive Experiences

Didactic Maps

Animation and narration adds new dimensions to our maps.  We can now offer guided tours of the world of biodiversity. In addition, we can orient our projects by navigating from a global perspective to project location. We can even drape our drone imagery over an elevation models that give 360 degree views of the recovering forests.

These and many other comparable maps are on our companion website. The strategic maps that show where we work are here.

help save the world's great forests

Help Us Have a Bigger Impact

Give Someone A Forest 

Offset someone’s carbon footprint this year and you are giving two gifts. The first for your loved one. The second for the planet.

The time is now to enlist new trees in the fight against climate change

before you fly

Sign-Up for Our Newsletter

Stay connected for good news from the front lines of conservation.

Skip to content